Visual management techniques are a critical component in lean operations. Visual communication is the most effective way to communicate important information. Everything that is needed to understand the business and the workplace, and to operate effectively within them, should be communicated visually. Visual control is the most effective way to prevent problems from being hidden.
How information is conveyed may depend upon the longevity of the information. Departmental names, emergency exits and walkways may be dignified by durable fixed signs or paint. Information which changes more frequently such as process descriptions, targets and performance data, might be printed on paper. Information which may change from minute to minute may be best communicated electronically via screens.
Visual management can be used to answer seven questions:
1. What is the purpose of a function or area?
2. What activities are performed in the area?
3. How do people know what to do?
4. How do they know how to do it?
5. How do they know how well they are doing?
6. What should be done if performance expectations are not being met?
7. What is being done to make improvements?
1. What is the purpose or function of an area?
Helps employees to understand what goes on in different parts of the business
2. What activities are performed in the area?
Value stream maps or SIPOC (Supplier – Inputs – Processes – Outputs – Customers) charts can be used to show how the activities of the area fit in to the overall process(es).
3. How do people know what to do?
How is work scheduled, triggered and prioritised? Depending upon the nature of the work being performed, this could be a simple kanban system, a schedule or a process plan.
4. How do they know how to do it?
In a lean operation there is a standard way to perform each process. To ensure that staff continue to operate the standard work procedures, the process description must be visible in the workplace. If many processes can be carried out in the same location, then a method must be found to ensure that the correct process description is displayed for each process e.g. by associating a copy of the process description with the work. Floor marking, shadow boards etc also help workers perform their tasks correctly.

Visual instructions © 2016 Sherpa Consulting
5. How do they know how well they are doing?
Staff need to know how their performance compares with expectations. This may be a real time display for short duration activities, a Gannt chart for projects or a ‘plan v. actual’ chart showing performance over time for a range of key performance indicators (KPIs).
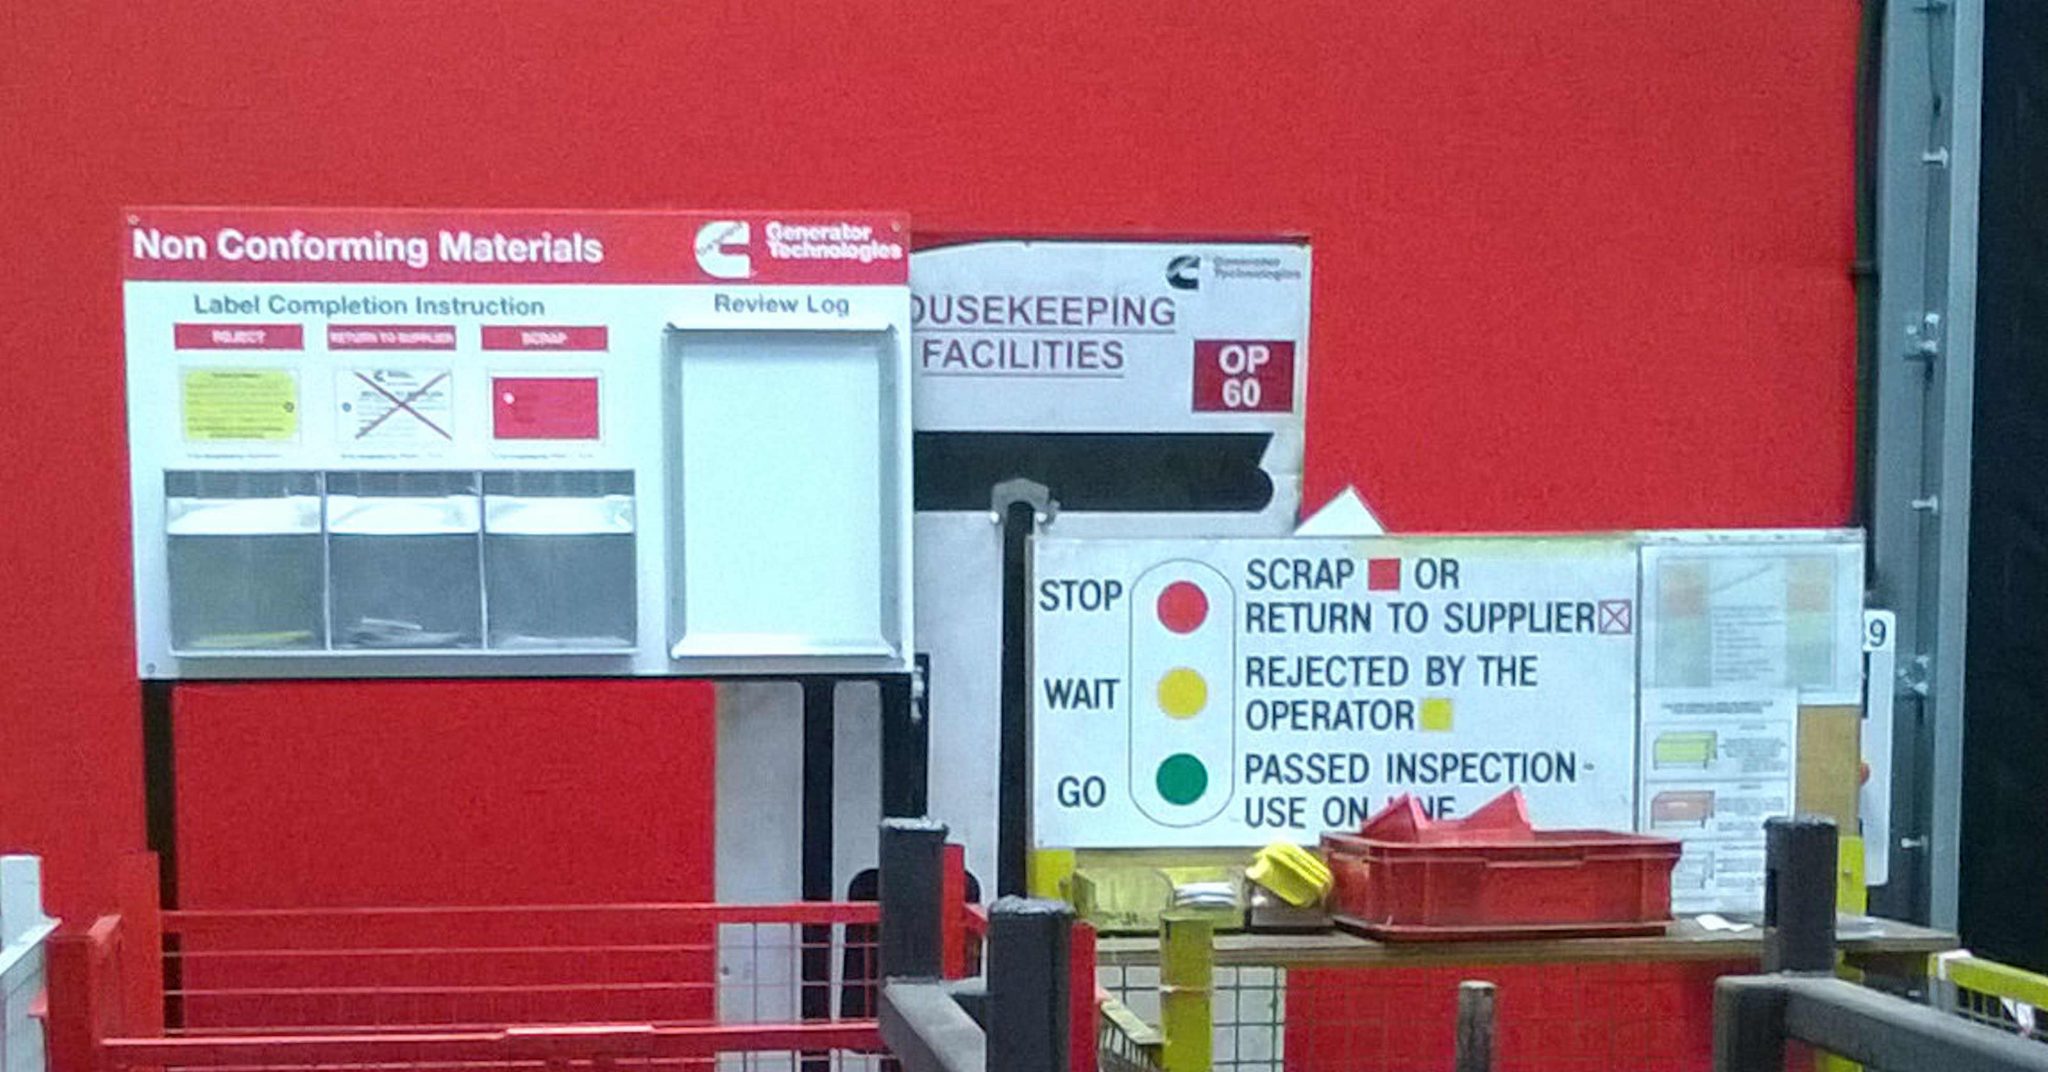
6. What should be done if performance expectations are not being met?
How should non-conforming situations be addressed? On a production line this may involve stopping the line and making a signal for assistance. In other situations making people aware of the problem but allowing the work to continue may be appropriate. Responses may be short term (immediate help to complete a task); medium term (maybe additional training); or long term (institute a process improvement project). An escalation process may be required to review problems and propose solutions.
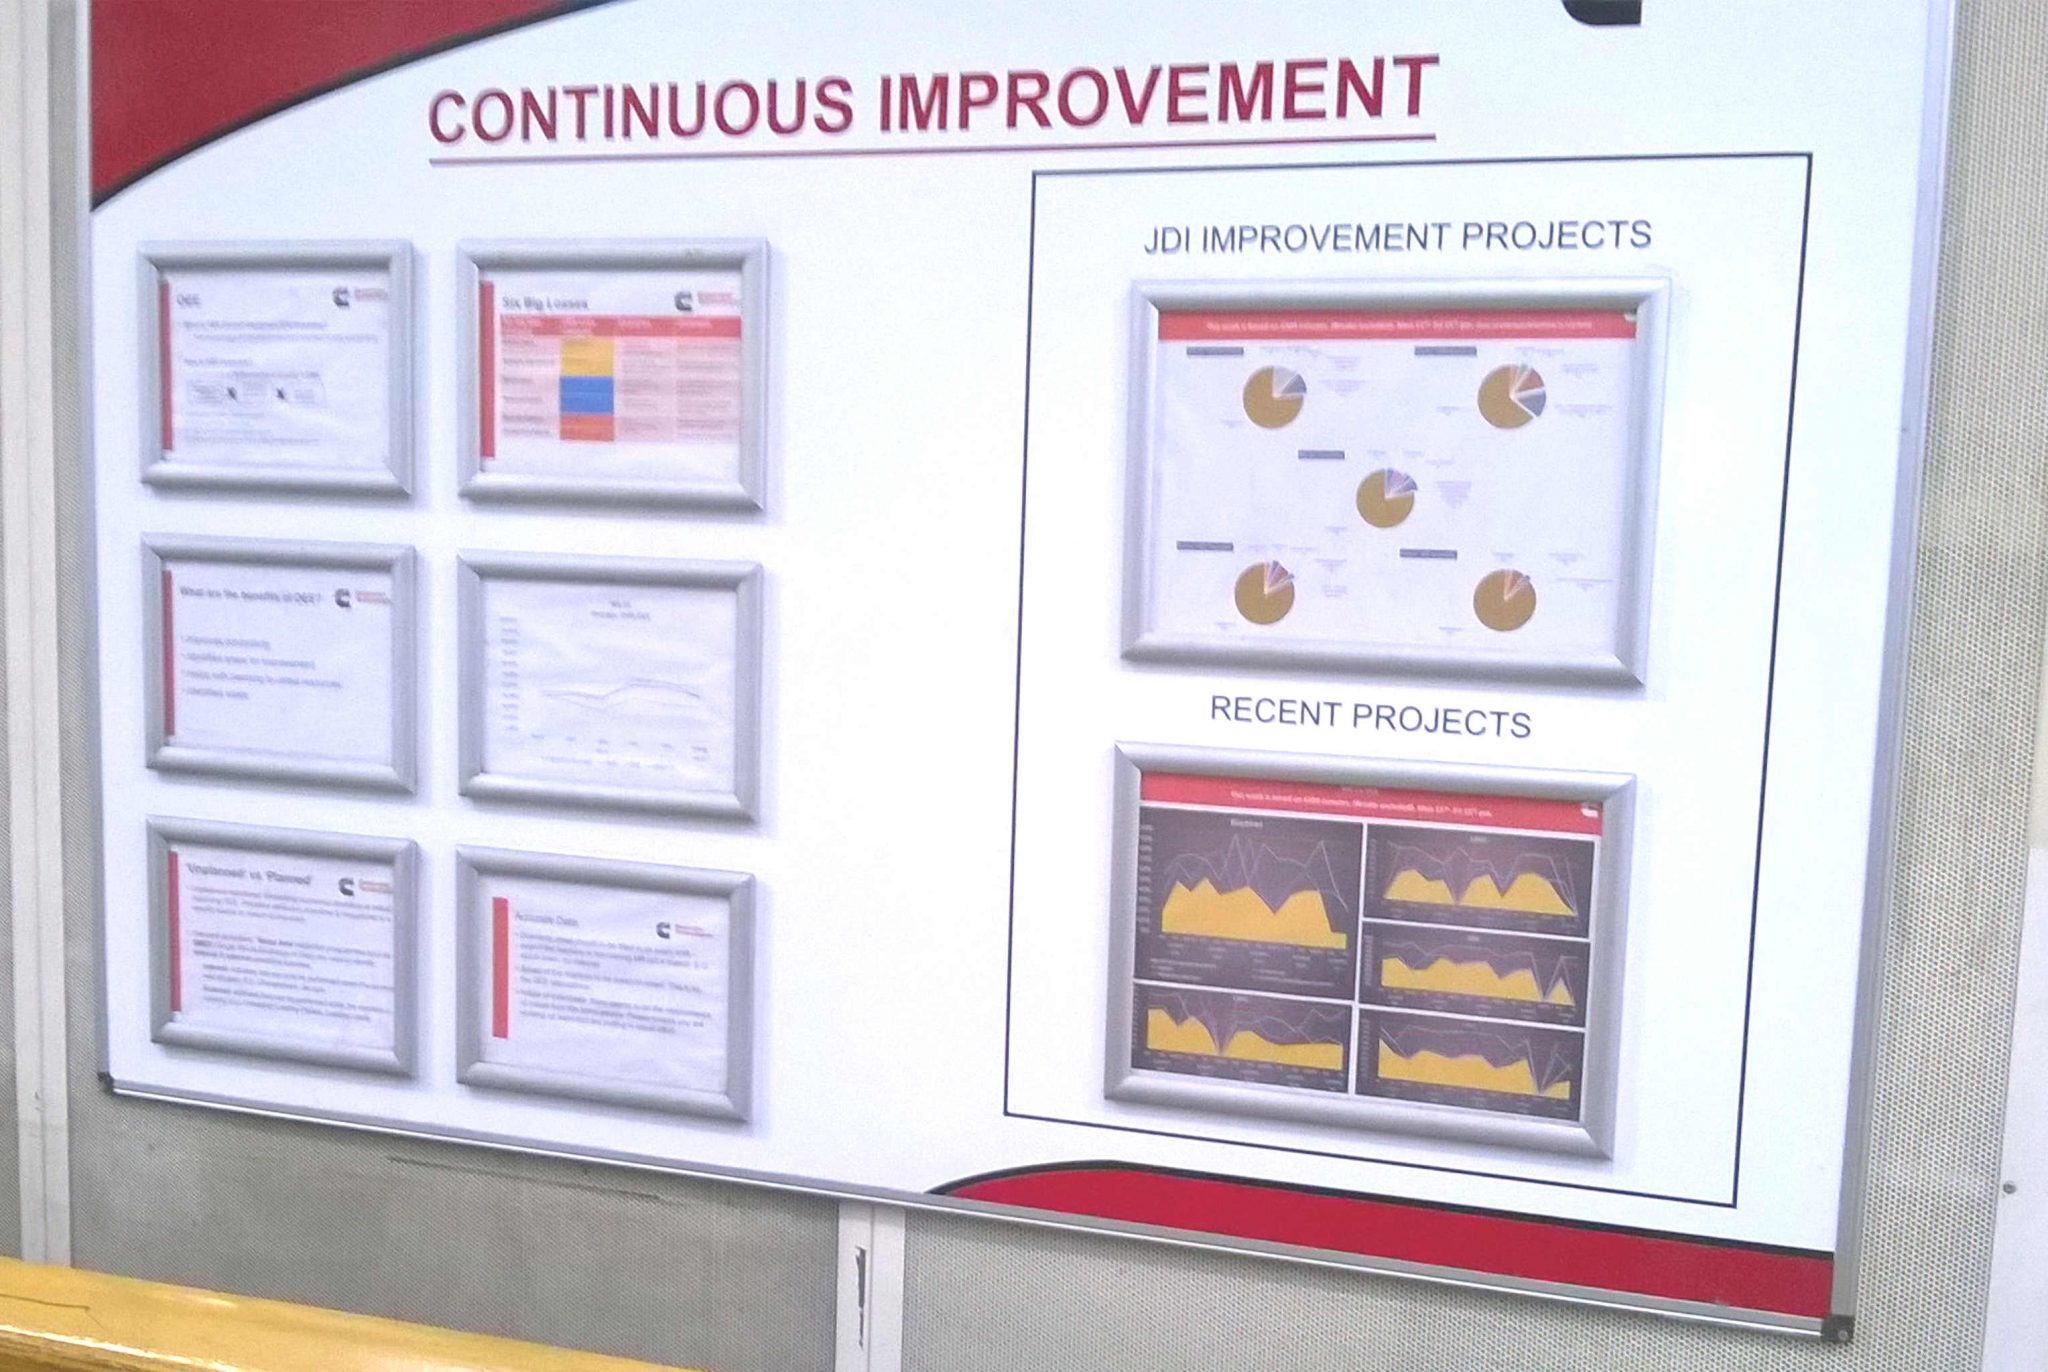
7. What is being done to make improvements?
A lean business is always looking to improve. Displaying charts and plans reporting on current process improvement projects both informs staff of work in progress and encourages the exploration of further improvement possibilities. Typically these will be in the form of A3 reports, although other charts expanding upon particular aspects of problem solving or project progress may also be appropriate.
For further examples of Visual Management in practice, see the Five S page.

© 2016 Sherpa Consulting