Different perspectives - creativity & visualisation
Different perspectives offer different solutions. Sherpa uses a wide range of creativity and visualisation techniques to help its clients gain fresh perspectives on their business.
Alternative approach - look around and steal
As an alternative to using visualisation techniques to gain insights into your business and processes, you could try stealing from elsewhere: Creative Swiping
Visualisation methods can help you to see your processes the way they are, not necessarily the way you are used to.
One of the hardest steps in process improvement can be recognising that things can be different.
So what are visualisation methods?
A visualisation method is a systematic, rule-based, external, permanent and graphic representation that depicts information in a way that is conducive to acquiring insights, developing understanding or communicating experience1.
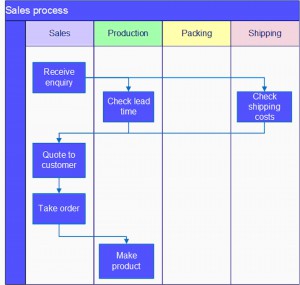
Example of a Swim-lane diagram
A simple example is a Swim Lane Diagram, which shows the flow of a process back and forth between functional
departments
A different perspective:
The first ascent of the Matterhorn

Photo by Marcel Wiesweg /CC BY-SA 3.0
By June 1865, Edward Whymper had failed six times to climb the Matterhorn via the South-West Ridge, believed to be the only viable route. The Eastern Face was considered to be far too steep to climb. Yet when viewing the face from the rarely visited slopes between the Z'Muttgletscher and the Matterhorngletscher, Whymper realised that not only was it climbable, but it was actually the easiest route to the summit. He climbed it successfully on 14th July that year by the new route.
Metaphor is so widely used that it is often overlooked as a creativity technique, yet a well-chosen metaphor may be very effective in encouraging us to think differently.
me'taph|or n. application of a name or descriptive term or phrase to an object or action to which it is imaginatively but not literally applicable (e.g. a glaring error, food for thought, leave no stone unturned).
Oxford English Dictionary
An excellent summary of available visualisation methods is produced by Visual-Literacy.org, a joint venture between the universities of Lugano, St. Gallen and Geneva, and the Technical College of Northwest Switzerland. They have arranged 100 methods using the metaphor of the Periodic Table to illustrate and classify the methods (the Periodic Table is used by chemists to represent relationships between elements and record their basic properties). To view the Periodic Table of Visualisation Methods click the periodic table thumbnail.

1Definition by Lengler and Eppler of the University of Lugano. A paper explaining the thinking behind the periodic table metaphor can be viewed here.

This paper requires Adobe Acrobat Reader. You can download Adobe Acrobat Reader here